 ExpressAgain
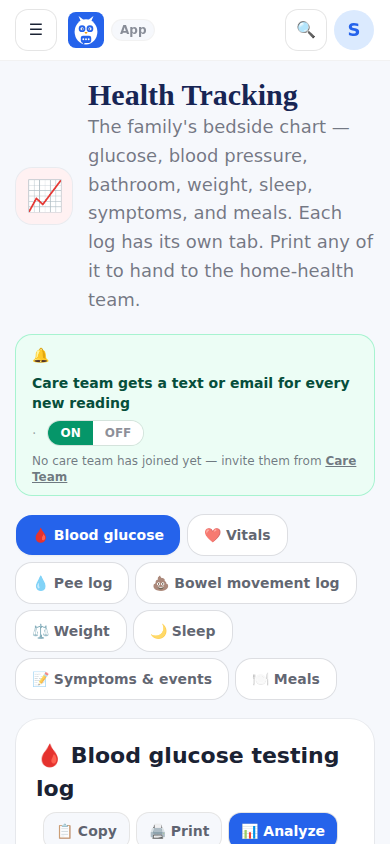
Health Tracking is the family's bedside chart, built for the home-health handoff. The blood-glucose grid is a digital twin of the paper testing log (before and two hours after each meal, bedtime, other, comments) and prints in the layout agencies expect. Then blood pressure; temperature, respirations, oxygen and pain; a pee log and a bowel movement log with last-one timers; weight; sleep; symptoms and events (dizzy spells, mood, falls, nausea, sleepiness); and Meals, which picks from what is in the kitchen and counts it down as she eats.
Copy and Print reproduce the sheet; Analyze describes what was logged — counts, averages, where the numbers cluster — in the care team's standard layout. The chart records and displays; it never judges a value or recommends treatment. Green and red only say inside or outside the target the family typed in.
The very same chart is on the care team's dashboard as the Health Tracking tab, with a Quick log on top. Every reading anyone logs carries who logged it, for example Maria (Home health).
What it looks like
Screens at phone width, with sample names — no real person’s information.